Checking your website for load speed performance is a best practice.
One of the aspects that can hurt your website with prospects and with search engines like Google is how fast can the website load. It is a good practice to test your website for load speed performance using free third-party tools. Everyone has experienced sites that take a long time to load. This obviously hurts a website in attracting new customers. Load time is also a big ranking factor for SEO optimization.
One of the best resources to use for testing a website is GTMetrix.
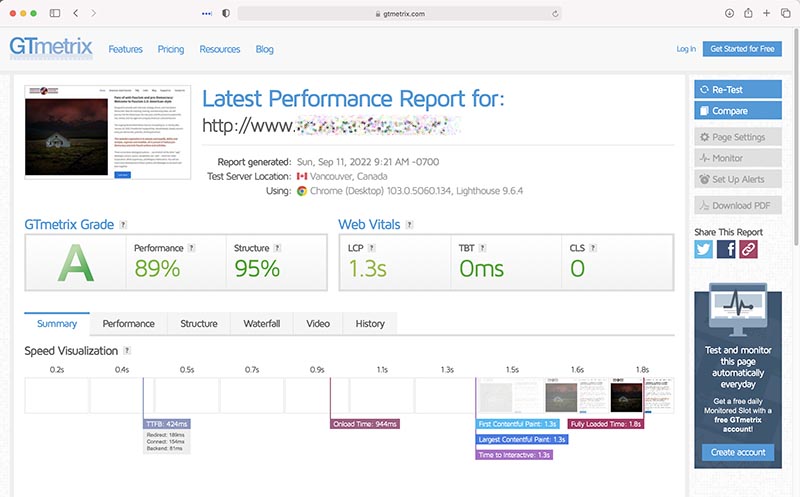
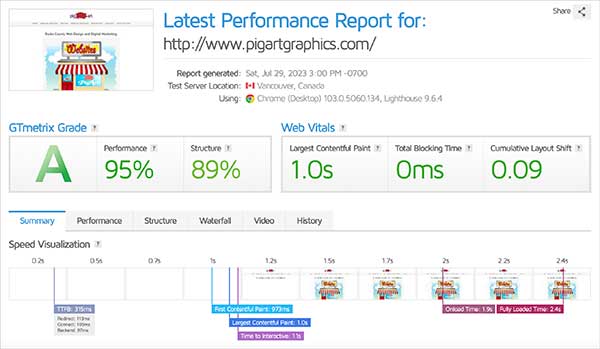
GTMetrix provides a free interface for testing the page load-time as well as providing a precise breakdown of what is happening behind the scenes.
GTmetrix Dashboard:

What The GT Metrix Chart Means:
- Performance. Your Performance Score is essentially your Lighthouse Performance Score, as captured by GTmetrix, with their custom audits, Analysis Options, browser and hardware specifications.
- Structure. Your Structure Score represents an assessment of Lighthouse and Custom GTmetrix audits. It indicates how well your page is built for optimal performance.
- Web Vitals: LCP. This measures how long it takes for the largest content element (e.g. a hero image or heading text) on your page to become visible within your visitors’ viewport. For a good user experience, aim for an LCP of 1.2 seconds or less.
- Web Vitals: TBT. TBT tells you how much time is blocked by scripts during your page loading process. For a good user experience, aim for a TBT of 150 milliseconds or less.
- Web Vitals: CLS. CLS indicates how much layout shift is experienced by visitors as your page loads. For a good user experience, aim for a CLS score of 0.1 or less
The Performance score is broken down based on these tests:
- Loading performance (45%)
- First Contentful Paint (10%)
- Speed Index (10%)
- Largest Contentful Paint (25%)
- Interactivity (40%)
- Time to Interactive (10%)
- Total Blocking Time (30%)
- Visual Stability (15%)
- Cumulative Layout Shift (15%)
What Speed Visualization Means:
Speed Visualization provides an overlaid timeline in milliseconds that pinpoints how long it takes the page to fully load and at what intervals different resources likes images and scripts are being loaded. At the right hand side of the graph is the time it takes for your page to fully load.
Areas For Website Improvement
Let’s say that your performance score was a B or even an F. I’ve seen those before and it really sucks. The better value of GT Metric is that it provides a list of steps to take to improve your score and these are even ranked in more important and less important items.

Website Performance Summary
It takes a lot of work putting together your website between the content, the writing and images. Now that you’ve made your website, it’s important that your customers and fans can have a positive experience visiting your website. I highly recommend using GT Metrix to test your website. It’s much fun when you do get an A. After I got an A, I ran upstairs to tell my wife!
My GTMetrix Report Link


